Let’s assume you live on a sailboat, or at least spend enough time on it to want a normal internet connection there. Marina Wi-Fi works only in the marina office, if at all. A phone hotspot works until the phone goes ashore with its owner. What a boat really needs is its own LTE/5G router, mounted outside and high, with everything on board connected to it.
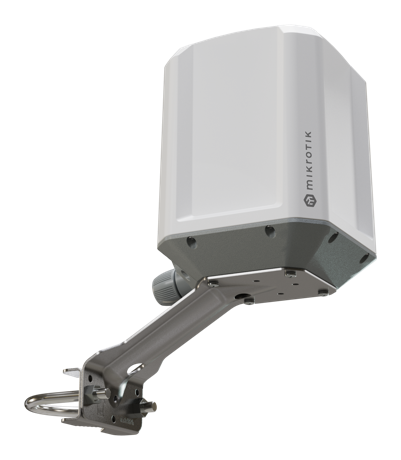
I took the MikroTik LAMP 5G R16 for that job. It’s an outdoor 5G router in a sealed IP67 box with the antennas inside, a Quectel RG520F modem, GNSS, PoE-in on a single Ethernet port and EN 60945 certification, which is the standard for marine electronics. It’s rated for -40…+70 °C, so a summer deck is not a problem. One cable goes down into the boat and that’s it.
Disclaimer: MikroTik is a wonderful hardware that is configured with RouterOS, which is a wonderful operating system with the worst learning curve in the networking world. It does everything, and every thing is done in a way you don’t expect. Don’t panic: you don’t need to understand the commands below. You need to copy, paste and read what the router answers.
What we’re building
SIM ~~5G/LTE~~ LAMP ──cable── laptop, Wi-Fi router or LAN-to-Wi-Fi adapter
LAMP gets the internet from the SIM card and hands it to the boat network on its Ethernet port. Wi-Fi comes from whatever you connect behind it.
Prerequisites
LAMP 5G R16 with its PoE power
An active SIM: either a physical one inserted into LAMP, or an eSIM profile already installed on it (the R16 supports both)
A computer with an Ethernet port (or adapter) and a cable
The admin password from LAMP’s sticker
Your carrier’s APN, see below
Talking to the router
Important: Take a picture of the sticker at the bottom of the device and save it safely and tagged where you could find it later if you’ll ever need to reset the router and the sticker is far gone already.
RouterOS is configured with commands typed into a Terminal. Plug the cable into the computer, switch the computer’s Wi-Fi off so it uses the cable, wait 30 seconds and open the Terminal one of the two ways:
Browser: go to http://192.168.188.1 (LAMP’s default), log in as admin with the sticker password, click Terminal.
Winbox (recommended): download it from mikrotik.com/download, open the Neighbors tab, click the LAMP, log in, click New Terminal. Winbox connects by MAC address, so it works even when the router’s IP is unknown or wrong. This will save you more than once.
You’ll see a prompt like [admin@MikroTik] >. Paste with right-click → Paste (Ctrl+Shift+V in the browser), press Enter, read the output. Errors tell you the problem and the position in the line.
Warning: never hold the RESET button for more than 2 seconds unless you want to erase the whole configuration.
Checking the modem and the SIM
Find the modem’s name:
/interface lte print
It’s usually lte1. If yours differs, use it everywhere instead of lte1.
Check the SIM:
/interface lte monitor lte1 once
Line
Good value
If not
pin-status
ok
The SIM wants a PIN. Set SIMPIN in the script below.
registration-status
registered
No network. Check the signal or whether the SIM is active.
current-operator
your carrier
—
The APN
The APN tells the modem how to connect to your carrier’s internet. Look for “APN” on the carrier’s website. In Italy, where the boat lives:
Carrier
APN
WindTre
internet.it
Very Mobile
internet.it
TIM
ibox.tim.it
Vodafone
mobile.vodafone.it
Iliad
iliad
Note: this is the first thing I tripped over. The factory APN profile had LTE passthrough enabled, which hands the carrier’s IP straight to the device behind the router and breaks routing for everybody else. The script creates its own profile with passthrough off and with the APN you set.
Why one ugly script
The router came with a factory config, plus everything I had already clicked around in it, plus whatever the carrier pushed. So I wanted one script that brings it to a known state, whatever state it’s in now, and can be run again any number of times.
RouterOS has its own idea of what a script is, and /import makes it worse:
every line runs on its own, so :local variables don’t survive to the next line. Hence :global re-declared on every line that needs it;
a syntax error aborts the whole import, and on-error can’t catch it;
multi-line blocks { ... } break on import, and long lines break when you copy them out of a terminal;
removing something that doesn’t exist is an error, so every cleanup is wrapped in :do { ... } on-error={}.
The result is a flat list of one-liners that looks stupid and works every time. Believe me, I tried the clever version first. Several times.
The setup script
Create a plain-text file lamp-setup.rsc and edit only the SETTINGS block at the top:
Setting
What it is
Example
LANP
First three numbers of the boat network. The router becomes LANP.1, devices get LANP.100–LANP.254.
"192.168.188"
APN
Your carrier’s APN.
"internet.it"
LTEIF
Modem name.
"lte1"
SIMPIN
SIM PIN, "" if none.
"1234"
ADMINPASS
New admin password, "" keeps the current one.
"MyStrongPass42"
RNAME
Router name in the prompt.
"LAMP"
DNS1, DNS2
Internet name servers.
"1.1.1.1", "9.9.9.9"
SMSSECRET
Password for running router scripts by SMS. Long and random, "" keeps the current one.
"k3Rv9QxT7mWz2LpA"
Tip: if you put a Wi-Fi router behind LAMP, LANP must differ from that router’s own network. Many of them use 192.168.0 or 192.168.1.
LTE/5G with your APN, IPv4 and IPv6, passthrough off.
Boat network
All Ethernet ports bridged. Router at LANP.1, DHCP hands out LANP.100–LANP.254.
DNS
The router answers the boat network, using DNS1 and DNS2.
Firewall
Nothing from the internet reaches the router or the boat network, IPv4 and IPv6.
Management
Web, SSH and Winbox only from the boat network. Telnet, FTP and API off.
Watchdog
Pings 1.1.1.1 every 2 minutes and restarts the LTE connection when it stops answering.
SMS
Receiving on, so the carrier’s texts (balance, top-up, login codes) land in /tool sms inbox.
Time
Time zone detected automatically, clock synced over NTP.
Note: the SMS part is easy to forget, and you’ll miss it the first time the carrier sends a verification code to a SIM sitting on top of the mast. RouterOS ships with SMS receiving off and the port set to none, so the inbox stays empty forever and nothing tells you why.
Running it
Upload the file: drag it into Files in Winbox, or from the command line:
scp lamp-setup.rsc admin@192.168.188.1:
And run it in the Terminal:
/import file-name=lamp-setup.rsc verbose=yes
The router prints every line as it goes. If it stops with an error, fix the cause and run it again: running it again is safe, that’s the whole point. If you changed LANP, the Terminal freezes at the end. That’s expected: the router has just changed its address. Unplug and replug the cable and reconnect at http://LANP.1, or simply through Winbox → Neighbors.
Checking the result
Wait 30 seconds and paste:
/log print where message~"lamp-setup"; /ip route print where dst-address=0.0.0.0/0; ping 1.1.1.1 count=3; /tool sms print
Check
Good result
Log
lamp-setup: start and lamp-setup: done, no FAIL lines
Route
One 0.0.0.0/0 line with the modem as gateway
Ping
received=3
SMS
status: running, receive-enabled: yes, port: lte1
Send a text to the SIM from a phone, and within about 10 seconds it shows up in /tool sms inbox print. Hooraaah!
The SIM holds only a few dozen messages, and when it’s full, new ones silently stop arriving. The MikroTik manual tells you to set auto-erase=yes. Don’t bother: RouterOS 7 doesn’t have it anymore, the manual page is from the v6 days. So here’s a tiny script that keeps the newest 20 messages, run every hour and after every boot:
LAMP has no Wi-Fi of its own, it’s an outdoor box with one Ethernet port. Connect behind it either:
a Wi-Fi router by its WAN port, with its own network range different from LANP;
an access point or a LAN-to-Wi-Fi adapter, then Wi-Fi devices get addresses from LAMP directly.
When the internet drops
And it will. 5G NSA in a busy marina with a poor signal-to-noise ratio is a lottery: the network rearranges the 5G part of the connection, the modem stops passing data, and RouterOS keeps showing the link as up and running. The lte-check watchdog restarts the connection once, and if that doesn’t help, it waits for the internet to come back first, which it won’t.
Important: don’t build anything that power-cycles the modem automatically. The modem also gives you GPS, and every power-cycle costs 6 to 12 minutes of cold start without a position. At sea, out of coverage, such a watchdog would kill your GPS again and again exactly when you need it.
Before you power-cycle or reboot by hand, run /log print: the log lives in memory and a reboot wipes it. If the problem keeps coming back, save the log on flash for a while:
LTE debug messages stay in: they show what the modem and the network actually did, and that’s where the cause hides. Raw modem traffic stays out, or it floods the flash within minutes.
When it happens again, note the time, collect the status (remove the imei, imsi, iccid and msisdn lines before sharing):
My MikroTik LAMP router (RouterOS, Quectel RG520F 5G modem, carrier: ___) loses
internet now and then. Last time: ___ (date and time, router clock), it came back
after ___ (by itself / LTE restart / modem power-cycle / router reboot).
Attached: the router's disk log (log.0.txt, log.1.txt; log.1 is older) and status
output (status.txt). The netwatch entry "lte-check" restarts LTE when 1.1.1.1 stops
answering.
1. Find the events around the outage and explain what happened, step by step.
2. Tell me whether the cause is the radio signal, the carrier's network, the modem,
   or the router configuration.
3. Suggest fixes in order of safety. Give RouterOS commands I can paste, and say
   what each one changes and how to undo it.
Don't suggest anything that restarts the modem automatically: the modem also
provides GPS for navigation.
It reads a thousand lines of MBIM debug much faster than you do. When you’re done, switch the disk logging off, the flash will thank you:
Locked out completely? Unplug the power, hold RESET, plug the power back, keep holding until the LED flashes (about 5 seconds). Everything is erased, run the script again.
Need to clear the SMS inbox right now? /tool sms inbox remove [find].
Unicode SMS come garbled: RouterOS reads plain GSM text only.
After a RouterOS update, extra packages must match the new version exactly. You’ll need that for the next part.
Next time: getting the boat’s GPS position out of LAMP and onto the navigation tablet over NMEA, with a tiny container running on the router itself.
Making a dumbest tablet a navigation device with NMEA
Making a dumbest tablet a navigation device with NMEA
Let’s assume you have a boat and want a big screen with charts at the helm or at the chart table. A new decent marine plotter costs like a hell of a fancy rigid-bottom dinghy. A new tablet with GPS isn’t cheap either, and you’d be scared to bring it into the cockpit anyway. Meanwhile, the second-hand market is full of tablets that people replaced years ago: perfectly fine screens, decent batteries, Android that still runs a chart app. Some of them cost less than a dinner in the marina.
There’s a catch, of course. Most of them are Wi-Fi only models, and Wi-Fi only usually means GPS-less. Take the one in the picture, a Samsung Galaxy Tab A 10.5 from 2018: GPS is in the cellular version only, and the one you find for pennies is the Wi-Fi version. Install a chart app on it and it shows you a beautiful chart of the whole Mediterranean with no idea where on it you are. A very expensive paper chart, basically. With a battery.
Disclaimer: the tablet is not dumb, it’s just lost. It can’t look at the sky, so somebody has to tell it where the boat is. Once per second, preferably.
The good news: the boats have been solving this problem since long before tablets. Marine electronics talk the NMEA protocol. Older devices speak NMEA 0183, newer ones NMEA 2000, or both. 0183 is the one we need here: a plain-text protocol from the 80s where a GPS says things like $GPRMC,...,4017.568202,N,00828.718960,E,... and everybody listening knows where the boat is. And almost every chart app worth installing (OpenCPN, qtVlm, SEAiq and friends) can listen to NMEA over the network: “connect to this address and port, read the position from there”. That’s the most basic thing that turns a dumb tablet into a navigation device: give it the position over Wi-Fi. Everything else, AIS, wind, depth, autopilot, comes later and plugs into the same idea.
So who tells the position? In the previous part the boat got a MikroTik LAMP 5G R16 router, mounted outside, under the open sky. Its Quectel modem has a GNSS receiver inside. It already knows where the boat is. It just doesn’t tell anybody. Let’s fix that.
RouterOS reads the modem’s GNSS. RouterOS can show the position, but it can’t serve NMEA to the network.
A tiny busybox container (about 1 MB) runs on the router itself. Once per second it asks the modem for fresh NMEA sentences through the router’s REST API.
The container serves them on TCP port 10110, the standard NMEA-over-TCP port. Any number of tablets, phones and laptops on the boat network can connect at the same time.
No extra hardware, no extra box to power, no extra cable through the deck. The router you already have becomes the boat’s GPS.
Prerequisites
LAMP set up as in the previous part, with the internet working (the router downloads a package and the container image).
A computer on the boat network, with the Terminal open as described there.
Physical access to LAMP’s power once. MikroTik makes you prove you’re standing next to the router before it allows containers.
A tablet with a chart app that accepts NMEA over TCP.
Checking the GPS
First, make sure the router has GPS at all:
/system package print
The list must contain gps. If it doesn’t, this router has no GPS support, and you can stop reading here with a clear conscience.
Then find the router’s address on the boat network:
/ip address print
The address on the line with bridge, without /24, is what I call LAMP_IP below. With the default from the previous part, it’s 192.168.188.1.
Installing the container package
Containers on RouterOS are an extra package that must match the router’s version exactly. This one-liner works out the version and architecture by itself and downloads the right one:
:local v [/system resource get version]; :local a [/system resource get architecture-name]; :set v [:pick $v 0 [:find $v " "]]; /tool fetch url=("https://download.mikrotik.com/routeros/" . $v . "/container-" . $v . "-" . $a . ".npk")
You should see status: finished. Reboot to install it (answer y):
/system reboot
Now the fun part. Containers are considered dangerous, so RouterOS wants physical confirmation:
/system device-mode update container=yes
The router answers with something like turn off power or reboot by pressing reset or mode button in 4m59s. Within 5 minutes, unplug LAMP’s power, wait 5 seconds and plug it back. On a mast this is the moment you appreciate PoE and a power plug somewhere inside the boat.
Warning: “pressing reset” here means a short press. Hold RESET for more than 2 seconds and you erase the whole configuration. Unplugging the power is the safer choice.
Check after it’s back:
/system package print; /system device-mode print
container must be in the package list and container: yes in device-mode.
The setup script
Same idea as in the previous part: one flat, ugly, rerunnable script that cleans up its own leftovers first and then sets everything up. It:
switches the modem’s GNSS on and makes it produce plain NMEA;
creates a virtual interface veth-nmea with the container at 172.17.0.2;
creates a router user nmea that can log in only from the container’s address;
creates the container from the busybox:musl image, starting on boot;
forwards port 10110 from the boat network to the container.
Create nmea-setup.rsc and edit only the SETTINGS block:
Setting
What it is
Change it?
NMEAPASS
Internal password between the router and the container.
Yes. Letters and digits only.
NMEAPORT
Port the tablet connects to.
Only if your app insists on another port.
NMEALTE
Modem name.
Only if /interface lte print shows something other than lte1.
Lines with +CME ERROR are normal: the script stops the GNSS before configuring it, and the modem complains if it was already stopped. Modems.
The container’s brain
The whole “NMEA server” is one shell script. tcpsvd from busybox listens on port 10110 and starts a copy of the script for every connected tablet. Each copy asks the modem AT+QGPSGNMEA="RMC" and AT+QGPSGNMEA="GGA" through the router’s REST API once per second, cuts the NMEA sentences out of the JSON answer and sends them to the tablet with proper \r\n line endings.
Note: the script cleans Windows line endings off itself before it runs. If you edit it in Notepad, a shell script with \r at every line end fails with error messages that make no sense at all. Ask me how I know.
Create run.sh. No changes needed, the two settings at the top are optional:
#!/bin/sh
# Serves the modem's GPS position as NMEA over TCP port 10110.# The router starts it as: run.sh serve <password> <lte-interface># ---- Optional settings ----SENTENCES="RMC GGA"# sentence types to send; also possible: GSA GSV VTGINTERVAL=1# seconds between updates# ---------------------------# Remove Windows line endings, then run the cleaned copy. #mkdir -p /tmp #[ -z "$NMEA_CLEAN"]&& tr -d '\r' < "$0" > /tmp/nmea.sh && export NMEA_CLEAN=1&& exec /bin/sh /tmp/nmea.sh "$@"#MODE="$1"; PASS="$2"; LTE="${3:-lte1}"if["$MODE" !="client"]; thenexec tcpsvd 0.0.0.0 10110 /bin/sh "$0" client "$PASS""$LTE"fiAPI="http://nmea:$PASS@172.17.0.1/rest/interface/lte/at-chat"while :; dofor s in $SENTENCES; dowget -q -O - --header 'Content-Type: application/json'\
--post-data "{\".id\":\"$LTE\",\"input\":\"AT+QGPSGNMEA=\\\"$s\\\"\"}""$API"\
| grep -oE '\$G[A-Z]{4},[^\\"]*'\
| while read -r l; do printf '%s\r\n'"$l"; donedonesleep "$INTERVAL"done
RMC carries position, speed, course and date, GGA carries the fix quality, satellites and altitude. That’s all a chart app needs. Add GSV if you want to look at the satellites in the sky view.
The setup created a folder for it, so upload it there:
scp run.sh admin@LAMP_IP:flash/nmea/run.sh
If scp complains about the protocol, add -O after scp.
Starting it
The router downloads the image in the background. Give it a minute or two and check:
/container print
No flag with status extracting means it’s still downloading. S means stopped, so start it:
The A right after the time in RMC means the position is valid. V means the stream works but the modem has no fix yet. Then it’s not the script, it’s the sky.
Teaching the tablet
In the chart app, look for something called NMEA source, External GPS, Network GPS or Connections, and add:
Setting
Value
Type
TCP, client
Host
LAMP_IP (probably 192.168.188.1 if you didn’t change it)
Port
10110
The tablet must be on the Wi-Fi behind LAMP. And that’s it: the dumb tablet sees a boat on its chart, exactly where the boat is. Hooraaah!
Tip: if the tablet connects but the app still shows no position, check the app’s settings for “use external GPS only” or similar. Some apps keep waiting for the internal GPS, which, as we know, doesn’t exist.
The truth about the modem’s GPS
The modem’s GNSS is good enough for navigation, but it’s no professional marine GPS, and it’s honest to say what I measured:
Situation
What happens
Cold start (after a modem power-cycle or a long time off)
6–8 minutes to the first fix, 12 under some conditions. Starts with 3–4 satellites.
Restart shortly after a fix
Fix in under a minute: the modem still remembers the satellites.
Under the open sky, a few minutes after the fix
8+ satellites, HDOP below 1, a few metres accuracy.
Indoors, under a fiberglass deck
3–4 satellites, HDOP 4–9, tens of metres. Sometimes no fix at all.
HDOP under 1 is good, 1–2 is fair, over 5 is poor.
I tried to make it faster, of course. Some notes to save you the evening:
XTRA (Qualcomm’s downloadable satellite data that speeds up the cold start) is on by default and never gets any data. The file must be uploaded into the modem as raw binary, and RouterOS’s at-chat can’t do that. Dead end.
SUPL (assisted GPS over the mobile network) can be configured, supl.google.com:7276 works with it, but I couldn’t prove any difference in the time to fix.
Multiband sounds great and gives nothing: the built-in antenna is L1 only, the modem sees no other band.
The antenna position beats any setting. LAMP outdoors with the open sky above it is the whole trick.
Important: every modem power-cycle is a GPS cold start. That’s why nothing on this boat power-cycles the modem automatically, even when the internet hangs. Losing the internet at sea is normal. Losing the position for 10 minutes every time the router thinks it lost the internet is not.
Troubleshooting
Start with:
/container print; /log print where topics~"container"
Symptom
Fix
bad command name container
The package isn’t installed. Repeat the download and reboot.
container: no in device-mode
The power wasn’t unplugged within 5 minutes. Repeat the device-mode step.
Container log: 401 Unauthorized
Password problem. Letters and digits only, run the setup again.
Container log: 400 Bad Request
Wrong modem name in NMEALTE.
Container log: can't open '/nmea/run.sh'
run.sh is in the wrong folder. Upload it to flash/nmea/.
Connection refused
Container not running, or wrong LAMP_IP/port.
Lines show V
No fix yet. More sky, more patience.
Computer connects, tablet doesn’t
The tablet is on some other Wi-Fi.
Nothing reaches LAMP from behind a Wi-Fi router
The Wi-Fi router uses the same network range as LAMP. Change one of them.
Some useful notes
Port 10110 has no password. Anyone on the boat Wi-Fi can read the position. On a boat that’s usually fine: if they’re on your Wi-Fi, they probably also know where the boat is.
After a RouterOS update, download the container package again with the one-liner above, or the container stops working. RouterOS doesn’t do that for you.
Next time: a Signal K dashboard showing the router’s LTE signal, GPS, SMS and a couple of red and green buttons to kick the internet when it hangs, without killing the GPS.
Let’s be honest: a modern boat without internet is a boat without half of its brains. Weather forecasts and GRIB files, the marina’s WhatsApp, the AIS picture beyond the horizon, chart updates, the bank’s login code, work (yes, some of us work from the boat), and the kids’ cartoons, which are the most mission-critical service on board. When the internet drops, everything is “loading…”, and the whole crew looks at you, because you’re the one who installed “that router”.
And here’s the funny part: the router is the one device on board you can’t just go and look at. LAMP sits on top of the mast or on the pushpit, in its sealed box, with one cable going down. No lights to stare at, no screen, nothing. Is it the signal? Is it the carrier? Is the router alive at all? Did the modem decide to take a nap while still saying it’s connected? It happens, and it’s a true issue: 5G in a busy marina is a lottery, and LTE out at sea is a lottery without tickets.
Disclaimer: there’s no cure for a bad signal. A dashboard won’t give you internet in the middle of the Tyrrhenian Sea. But it will tell you in one glance whether it’s the sea, the carrier or the router, and that’s half of the solution.
So LAMP needs an eye. And the boat most probably already has the right place to put it: Signal K, the open-source boat data server that collects everything from NMEA, sensors and instruments, often running on a Raspberry Pi somewhere under the chart table. If it shows the wind and the depth, it can show the internet too.
What we’re building
LAMP (LTE, GNSS, SMS) ─┐
                       ├──REST, read-only── Signal K plugin ──WebSocket── dashboard on any tablet/phone/laptop
RB751G (Wi-Fi) ────────┘
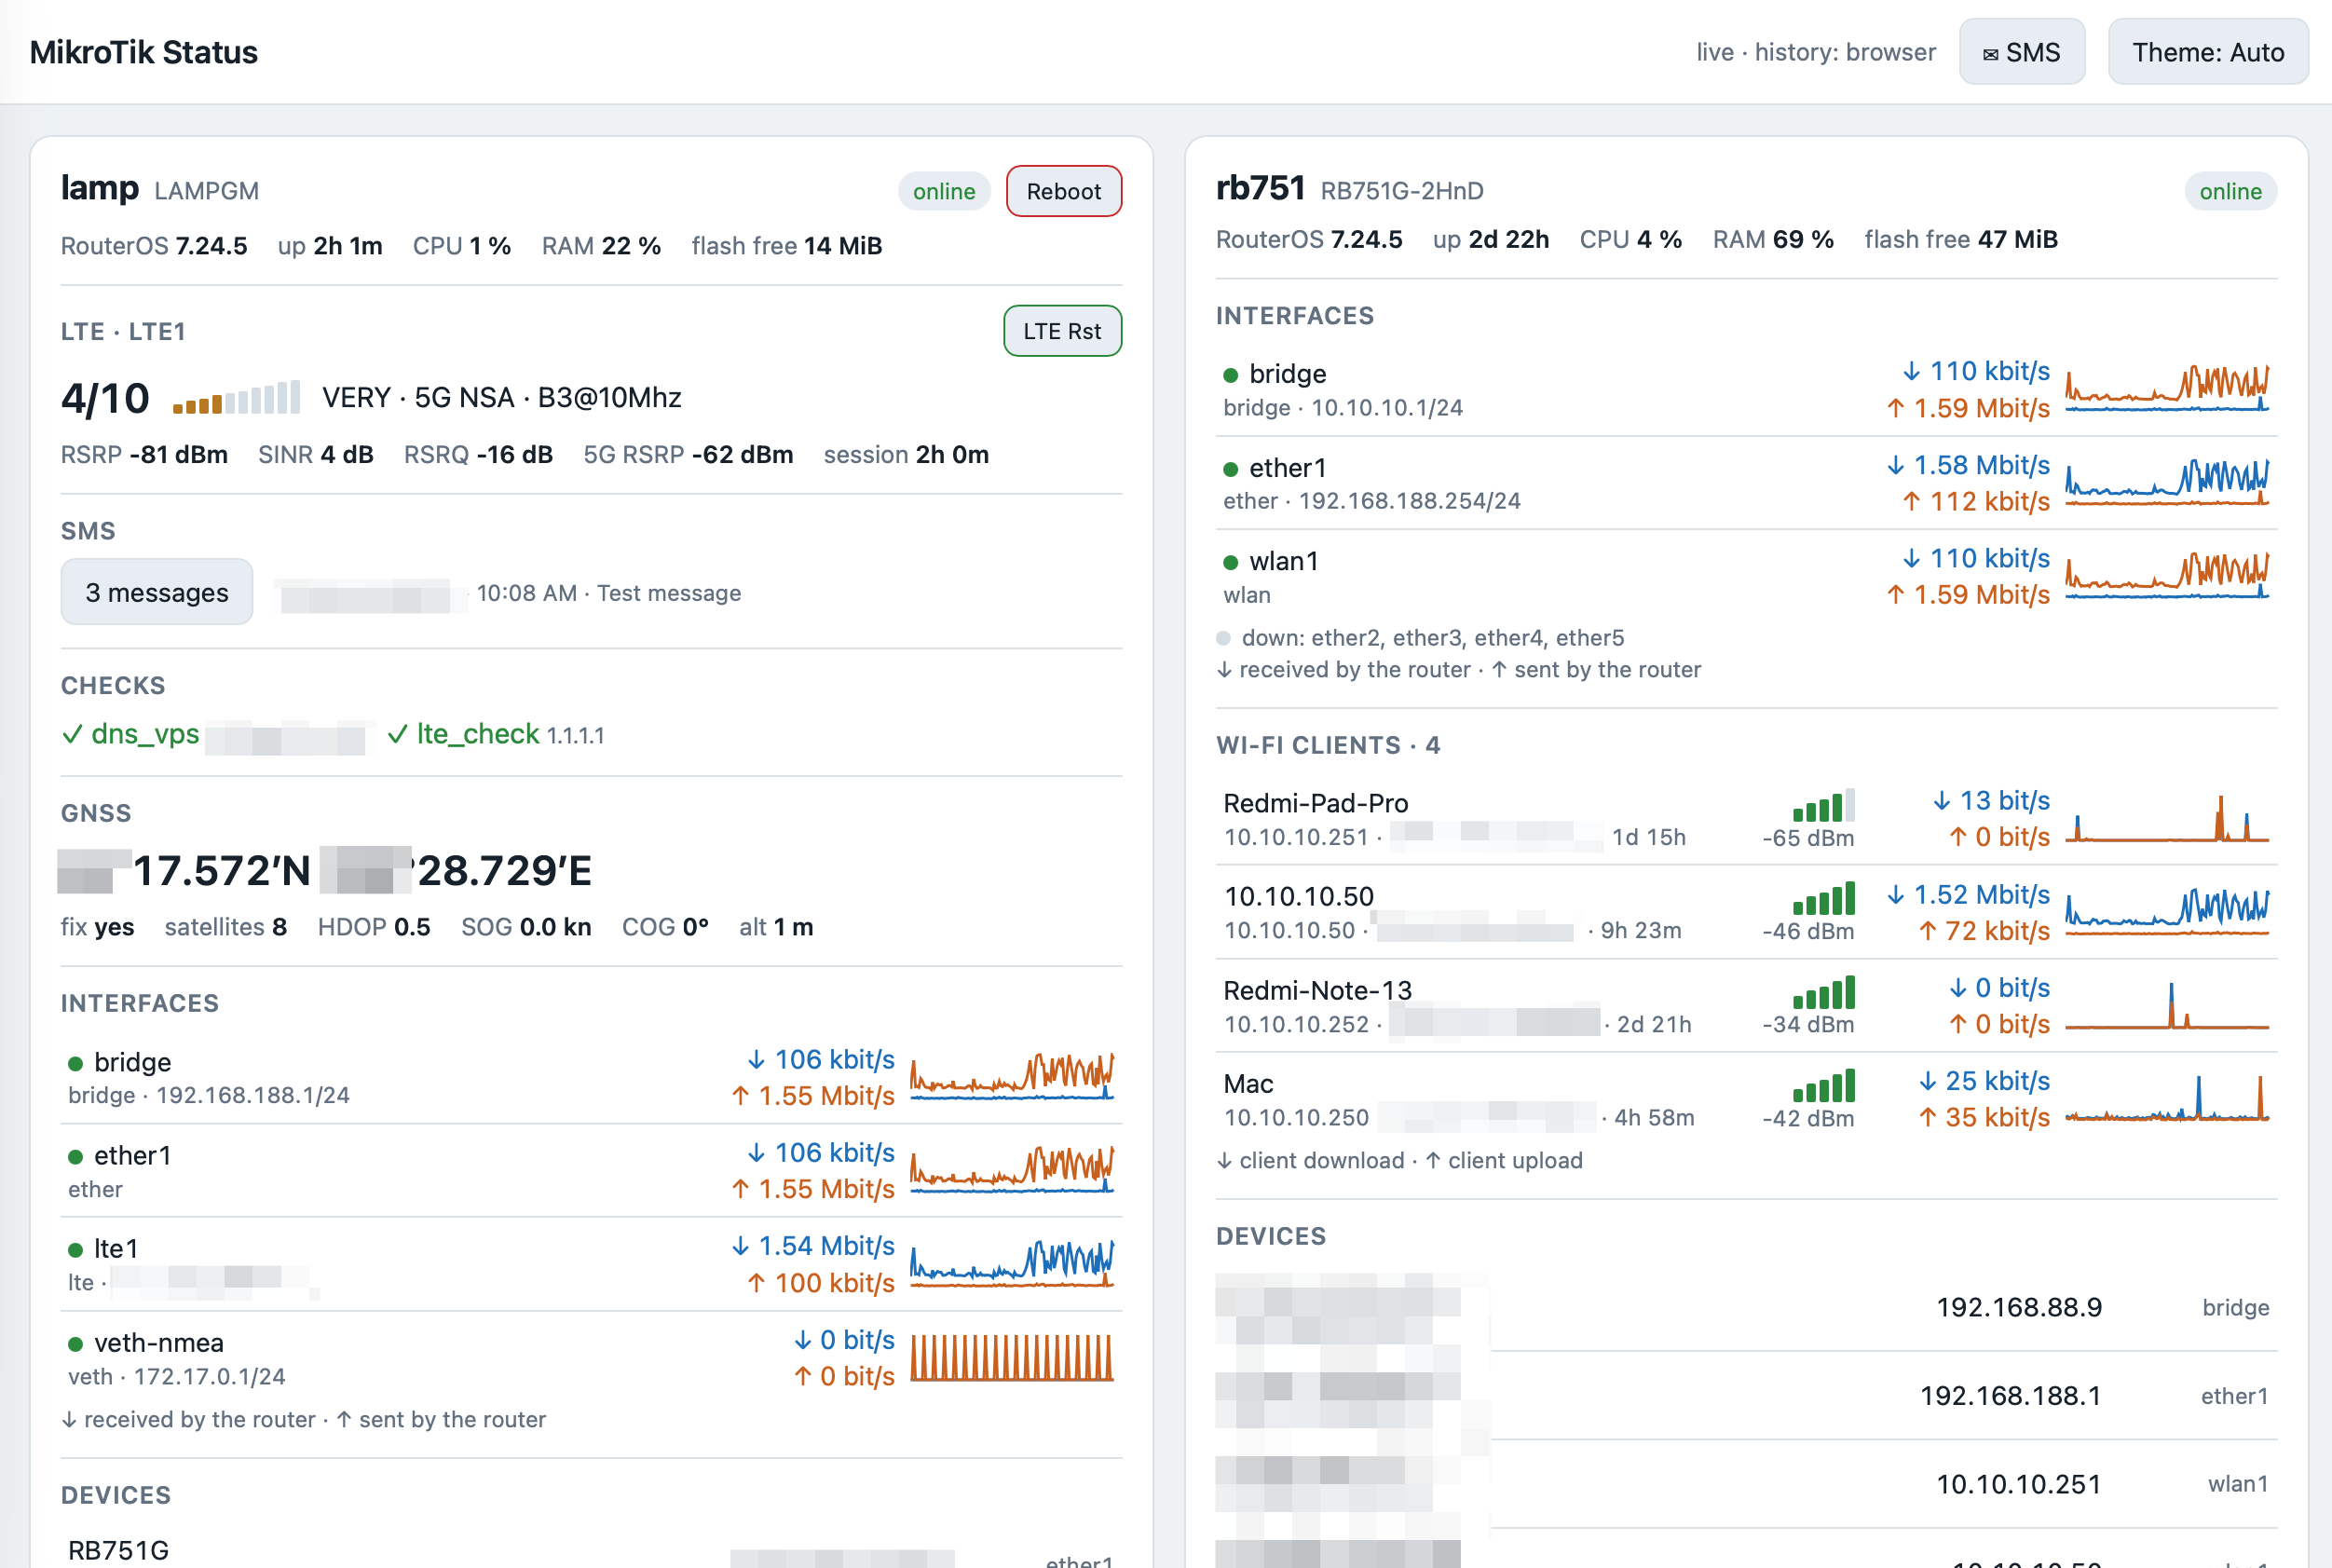
A small Signal K plugin, signalk-mikrotik, reads every MikroTik router on board through the RouterOS REST API and publishes everything under mikrotik.<router>.*. The same plugin serves a dashboard web page, the one in the picture above. One card per router, built from whatever the router has: no LTE, no LTE section; no Wi-Fi, no Wi-Fi section.
What you see on LAMP’s card:
Section
What it tells you
Header
RouterOS version, uptime, CPU, RAM, free flash, online badge. And a red Reboot button.
LTE
Signal score 1–10 with bars, 4G or 5G, band, RSRP, SINR, RSRQ, how long the session lives. “Connection issues” in red when the internet is gone, a 5G switch and a green LTE Rst button.
SMS
How many messages, the latest one. Tap to read all of them.
Checks
The router’s netwatch entries, ✓ or ✗.
GNSS
Position, fix, satellites, HDOP, speed, course.
Interfaces
Traffic in and out with a 10-minute chart.
Devices
Who’s connected where.
And on the Wi-Fi router’s card: the Wi-Fi clients with their signal and traffic. That’s how you find out that it’s not the internet that is slow, it’s the kid’s tablet downloading a 40 GB game update.
The useful thing is the combination. “Signal 2/10, SINR −3 dB” means move the boat or wait. “Signal 7/10, Connection issues” means the carrier or the modem is stuck, press LTE Rst. “Card is grey, offline since 14:32” means the router itself is gone, go check the cable. No guessing.
Prerequisites
Signal K server 2.x on Node.js 18 or newer.
MikroTik routers with RouterOS 7.9 or newer. LAMP from the first part, and any other MikroTik on board.
The Signal K host can reach the routers on TCP port 80.
For the recovery buttons: the NMEA container from the second part.
Preparing the routers
On each router, create a user that can read everything and change nothing. Replace SK_PASS with a password of letters and digits:
/user group add name=signalk policy=read,test,api,rest-api
/user add name=signalk group=signalk password=SK_PASS
read is for the settings and tables, test is for the LTE and GPS monitor commands. No write, so the dashboard can’t break anything even if it wanted to.
REST lives on the router’s web service, so make sure it’s on:
/ip service set www disabled=no
/ip service print where name=www
If the address column shows addresses, the Signal K host’s network must be among them. For example, LAMP set up as in the first part allows only its own boat network, and a Signal K box behind a second router comes from that router’s address:
/ip service set www address=192.168.188.0/24,10.10.10.0/24
Keep what was already there, add the new one with a comma.
On LAMP, set the GPS to decimal degrees, it’s the least ambiguous format:
JSON with cpu-load and uptime means it works. 401 means a wrong password. A timeout means www is off or doesn’t allow your address.
Note: REST over plain HTTP sends the password in clear text over the boat network. The user is read-only and the boat network is yours, so I can live with that. If you can’t, RouterOS can do HTTPS, but then you get to deal with certificates on a boat. Your choice.
SMS
If you followed the first part, LAMP already receives SMS and keeps the newest 20. Otherwise:
/tool sms set port=lte1 receive-enabled=yes polling=yes
The signalk user can read the inbox, nothing else to do. Why SMS on a dashboard at all? Because the carrier sends “your data plan is over” and “your top-up was successful” to the SIM that lives on the mast, and you’d better see those without climbing.
Installing the plugin
The plugin is three files: package.json, the plugin itself index.js and the dashboard public/index.html. Download them all at once as signalk-mikrotik.tar.gz to the Signal K host and install:
mkdir -p ~/signalk-plugins && cd ~/signalk-plugins
curl -LO https://y-b.one/signalk-mikrotik/signalk-mikrotik.tar.gz
tar xzf signalk-mikrotik.tar.gz
cd ~/.signalk && npm install ~/signalk-plugins/signalk-mikrotik
sudo systemctl restart signalk
No dependencies, nothing downloaded from npm. The plugin uses only what Node.js has built in, and the dashboard is one HTML file without external fonts or scripts, so it works when the internet doesn’t. Which is, you know, exactly when you need it.
Note: if Signal K runs in Docker, ~/.signalk lives in the container’s volume. Copy the folder there and run npm install inside the container.
Configuring it
In the Signal K admin: Server → Plugin Config → MikroTik RouterOS, tick Enabled and add one entry per router:
Field
LAMP
Wi-Fi router
Device ID in paths
lamp
rb751
Router IP address
192.168.188.1
10.10.10.1
User / Password
signalk / SK_PASS
signalk / SK_PASS
Interfaces to report
^(?!lo$)
^(?!lo$)
Recovery trigger URL
see below
empty
Click Submit. The status line says Polling 2 router(s): lamp, rb751, and the dashboard is at:
http://SIGNALK_IP:3000/signalk-mikrotik/
It’s also listed in the Signal K admin under Webapps as MikroTik Status. Put it on the tablet’s home screen and it’s an app.
What it reads and how often:
Data
Every
GNSS
1 s
Interface traffic, Wi-Fi clients, LTE signal
5 s
Devices, system, netwatch, SMS
30 s
Internet check
60 s
That’s about one request per second plus a handful every few seconds. Even the old RB751G with its 400 MHz CPU doesn’t notice.
Little things that matter
Themes: the Theme button cycles Auto → Day → Dark → Night, which is red on black. On a night watch you don’t want a white screen burning your night vision. Each tablet remembers its choice.
Offline routers don’t disappear: the card goes grey with the last values and offline since HH:MM. So you know when it died, which is often the best hint why.
SMS: a new message turns the header button into ✉ SMS · 1 new with a pulsing red dot. Tap it, and a side panel shows all messages, newest first. Each tablet tracks what it has already seen.
History: the charts keep 10 minutes in the browser. If Signal K records history (InfluxDB, for example), the charts load it on open.
Layout: two cards side by side on a tablet in landscape, one on a phone.
When the internet hangs
Every minute the plugin asks LAMP to ping 1.1.1.1 and 9.9.9.9. One answer from either is enough. Three minutes without any, and Connection issues appears in red next to the LTE heading. It goes away with the first answer.
That’s all it does automatically: it reports. It never restarts anything. I tried the automatic way first, of course, and it was a bad idea. The modem also gives the boat its GPS, and every modem restart costs up to 12 minutes without a position. In a marina that’s annoying. At sea, out of coverage, an automatic watchdog would kill the GPS again and again, every few minutes, exactly when it’s needed for navigation. So the dashboard tells you, and you decide.
To decide something, you need buttons:
LTE Rst, green, on the LTE heading. Switches the LTE connection off and on. The internet is back in about 20 seconds, the GPS usually keeps its fix. Try this first.
Reboot, red, in the card header. Reboots the whole router: internet, boat network, DNS and NMEA drop for about 2 minutes.
5G, a switch left of LTE Rst, green when on. Switches 5G off and on. Here’s why it exists: with a poor signal, 5G NSA (5G on top of LTE) can keep losing its 5G part, and the session goes dead while the router still says it’s connected. LTE Rst helps for a minute or two, then it dies again. With 5G off, LAMP stays on plain 4G LTE until you switch it back on, even after a reboot. If the hangs stop, you know who’s guilty.
Note: the modem has an AT command to switch 5G off (AT+QNWPREFCFG="nr5g_disable_mode"), but on MikroTik R16 devices RouterOS quietly reverts it within minutes. The switch changes RouterOS’s own network-mode instead, removing or adding 5g, and that one stays.
All of them ask for confirmation, and a second press within 3 minutes is refused, so a nervous double tap doesn’t reboot the router twice.
The trigger on LAMP
The plugin’s signalk user is read-only, and I want it to stay that way. So the buttons don’t talk to the router directly. They call a tiny web trigger running in the busybox container from the second part, on a secret address. It knows these actions:
Address ends with
Action
?lte
Restart the LTE connection.
?5g-off / ?5g-on
Switch 5G off (LTE only) and back on.
?reboot
Reboot the router.
nothing
Power-cycle the modem, as if you unplugged it for 5 seconds. For when even LTE Rst doesn’t help.
After a 5G switch, an LTE restart or a power-cycle, it also watches the router’s GPS reader for a few minutes and restarts it if it got stuck. Yes, that happens too: after a modem power-cycle RouterOS sometimes just stops reading the GPS until you switch it off and on.
Two more files go next to run.sh from the second part. start.sh starts the trigger and then the NMEA server as before. Edit only CYCLETOKEN, the secret part of the address, at least 20 random letters and digits (openssl rand -hex 12 makes one):
#!/bin/sh
# Starts the modem power-cycle web trigger, then the NMEA server (run.sh).# The router starts it as: start.sh serve <password> <lte-interface># ---- Setting ----CYCLETOKEN="ChangeMeToALongRandomString"# secret part of the trigger URL, letters and digits only# -----------------# Remove Windows line endings, then run the cleaned copy. #mkdir -p /tmp #[ -z "$START_CLEAN"]&& tr -d '\r' < "$0" > /tmp/start.sh && export START_CLEAN=1&& exec /bin/sh /tmp/start.sh "$@"## The trigger reads the router API address from here. /tmp is inside the container only.printf 'API=%s\n'"http://nmea:$2@172.17.0.1/rest" > /tmp/cycle.env
mkdir -p /tmp/www/cgi-bin
tr -d '\r' < /nmea/cycle.cgi > "/tmp/www/cgi-bin/$CYCLETOKEN"chmod 755"/tmp/www/cgi-bin/$CYCLETOKEN"httpd -p 8080 -h /tmp/www
exec /bin/sh /nmea/run.sh "$@"
cycle.cgi does the actual work through the router’s REST API, no changes needed:
#!/bin/sh
# Recovery trigger, through the router's REST API. One action per 3 minutes.# ?lte restart the LTE connection (interface off and on)# ?reboot reboot the whole router# ?5g-off switch 5G off (LTE only), ?5g-on switch it back on# (none) power-cycle the LTE modem# After any LTE change or a power-cycle it restarts the router's GPS reader if it got stuck.LOCK=/tmp/modem-cycle.last
LTE=lte1
[ -f /tmp/cycle.env ]&& . /tmp/cycle.env
[ -n "$API"]|| API=$(sed -n 's/^API="\(http:[^"]*\/rest\).*/\1/p' /nmea/run.sh)post(){# post <path> <json> wget -q -O - --header 'Content-Type: application/json' --post-data "$2""$API/$1"}if["$1"= gps ]; then# Background part: if the GPS reader gets no data, switch GPS off and on# (this also resends the init string to the modem). Up to about 4 minutes.for i in 1234567 8; do sleep 20case"$(post system/gps/monitor '{"once":""}')" in
*'"data-age":"never"'*|'') ;;
*) exit 0 ;;
esac post system/gps/set '{"enabled":"no"}' >/dev/null
post system/gps/set '{"enabled":"yes"}' >/dev/null
sleep 10done exit 1figps_watch(){if command -v setsid >/dev/null; then setsid /bin/sh "$0" gps </dev/null >/dev/null 2>&1 &
else /bin/sh "$0" gps </dev/null >/dev/null 2>&1 &
fi}now=$(cut -d. -f1 /proc/uptime)last=$(cat "$LOCK" 2>/dev/null || echo -1000)printf 'Content-Type: text/plain\r\n\r\n'if[$((now - last)) -lt 180]; then echo "busy: last action $((now - last)) s ago, try again in $((180- now + last)) s" exit 0fiecho "$now" > "$LOCK"case"$QUERY_STRING" in
lte)if post interface/lte/disable "{\"numbers\":\"$LTE\"}" >/dev/null; then sleep 5 post interface/lte/enable "{\"numbers\":\"$LTE\"}" >/dev/null
echo "ok: LTE restarted, internet is back in about 20 s" gps_watch
else rm -f "$LOCK" echo "error: router API call failed"fi ;;
5g-off|5g-on)# Reads the modem's network-mode and removes or adds only "5g". RouterOS reconnects LTE by itself. mode=$(wget -q -O - "$API/interface/lte?name=$LTE" | sed -n 's/.*"network-mode":"\([^"]*\)".*/\1/p')if[ -z "$mode"]; then rm -f "$LOCK" echo "error: router API call failed" exit 0fi new=$(echo ",$mode," | sed 's/,5g,/,/; s/^,//; s/,$//')[ -n "$new"]|| new=lte
["$QUERY_STRING"= 5g-on ]&& new="$new,5g"if post interface/lte/set "{\"numbers\":\"$LTE\",\"network-mode\":\"$new\"}" >/dev/null; thenif["$QUERY_STRING"= 5g-on ]; then echo "ok: 5G on, internet is back in about 20 s"else echo "ok: 5G off, LTE only until you switch it back on. Internet is back in about 20 s"fi gps_watch
else rm -f "$LOCK" echo "error: router API call failed"fi ;;
reboot)# The router answers, then reboots. No answer within 10 s: it was refused or is already going down.if wget -q -T 10 -O /dev/null --header 'Content-Type: application/json'\
--post-data '{}'"$API/system/reboot"; then echo "ok: router is rebooting, back in about 2 minutes"else rm -f "$LOCK" echo "error: reboot refused or no answer. Does the nmea group have the reboot permission?"fi ;;
*)if post system/routerboard/usb/power-reset '{"duration":"5s"}' >/dev/null; then echo "ok: modem power-cycled, LTE is back in about a minute, GPS fix a few minutes later" gps_watch
else rm -f "$LOCK" echo "error: router API call failed"fi ;;
esac
Upload both:
scp start.sh cycle.cgi admin@LAMP_IP:flash/nmea/
Warning: when replacing a file that is already on the router, RouterOS may silently keep the old one. Remove it first with /file remove flash/nmea/cycle.cgi, then upload again, and compare the size in /file print. This one cost me an evening.
Now open port 8080 to the container from the boat network, let the container’s nmea user reboot the router, and stop the container:
Wait until /container print shows S. The comment exited with status 143 is fine, that’s how a stopped container says goodbye. Then switch it to start.sh, keeping the password and the modem name from the second part:
:local c [/container get [find interface=veth-nmea] cmd]; /container set [find interface=veth-nmea] cmd=("/bin/sh /nmea/start.sh" . [:pick $c [:find $c " serve"] [:len $c]])
/container start [find interface=veth-nmea]
Test it from a browser on the boat network, the gentlest way:
http://LAMP_IP:8080/cgi-bin/CYCLETOKEN?lte
ok: LTE restarted, internet is back in about 20 s means it works. Put the address without ?lte into the plugin’s Recovery trigger URL, click Submit, and the buttons appear on the dashboard within 30 seconds.
Important: don’t send the trigger address in chat apps. Link previews open it, and your messenger power-cycles your modem. Funny once.
Troubleshooting
Symptom
Fix
Plugin not in Plugin Config
Not installed or the server not restarted. Check the server log for signalk-mikrotik.
Log: HTTP 401
Wrong user or password. Test with curl.
Log: fetch failed or TimeoutError
Router unreachable, or www off or not allowing the Signal K host.
No LTE values
The signalk group lacks test.
No GNSS values
GPS off on the router: /system gps print.
Position off by hundreds of km
coordinate-format=dd on the router.
Dashboard says “Waiting for data”
Plugin disabled, or no router answers.
No 5G / LTE Rst / Reboot buttons
No Recovery trigger URL in the plugin settings.
A button says error: trigger unreachable
The container isn’t running, or the URL is wrong. Open it from a laptop.
A button says reboot refused
Run the user group set nmea line above.
A button says not allowed
Signal K security is on: log in to Signal K in the same browser.
SMS text is garbled
Unicode SMS. RouterOS reads plain GSM text only. Not fixable.
Some useful notes
The position stays under mikrotik.lamp.gnss.* and is not written to the boat’s navigation.position on purpose. If you have a better GPS, like an AIS transponder’s antenna, it shouldn’t have to compete with a router.
SMS texts are in the Signal K data, bank codes included. Anyone who can open Signal K can read them. On a family boat that’s fine. On a charter boat, think twice.
The signalk user can read the whole router configuration. It can’t change anything, but keep the boat network for the boat.
The plugin never deletes or sends SMS. The sms-keep-20 script from the first part does the cleaning.
Now, when the crew asks “why is the internet not working?”, you open the tablet, look at one card, and say something smart like “SINR is minus three, we’re behind the breakwater”. They won’t understand a word, but they’ll trust you. Hooraaah!
Humble-bundle for devops
Oreily’s Humble-Budle pack for DevOps guys
If you’re thinking about intensifying your career, you’ll defiinitely will find something useful among these books.
Full list:
Consul: Up and Running
Modern System Administration
97 Things Every Information Security Professional Should Know
The hiring process for high-tech is completely screwed. Here's why and how I fixed it for me and my team
The history
About eleven years ago, I stepped into team management for the first time. One of my first tasks was to open a position for an “any-key support specialist”. At the time, I was a system administrator. I posted about the open position and received a large number of resumes from people who barely understood which side they should approach the computer from.
The process was very difficult for me. I had to review hundreds of resumes and narrow it down to about 15 for further review. When I called to speak with the candidates, I often found that they had exaggerated their qualifications. In the end, I was lucky to get one from all above that was somewhat acceptable — lacking of knowledge and experience, but promising in the way he thinks.
He never after disappointed me, but the process was really exhausting.
The story
About a year later, I had to hire more people — programmers at this point — and was immediately overwhelmed at the thought of going through the same soul-sucking process again. I almost became depressed looking forward to wade through a flood of resumes from people who were pretending to be professionals, when in reality they were just a scam. An additional challenge was how could I estimate their qualification if I’m not a programmer myself? Yes, I can do some basic programming, profound in Bash scripting, but I had to find good PHP/JS programmers while knowing close to nothing about that.
So, I started thinking how to dodge all that mess.
The problem
First of all, let’s see how the common job-posting looks alike:
There are two to ten paragraphs of information about the hiring company. However, much of this information is superficial and does not provide any valuable insight into the company. It simply serves to puff up the company’s ego and promote an image of exceptionalism. While it may be tempting to include this type of fluff in a job description, it is unlikely that anyone will actually take the time to read it. It is much more important to provide concrete details about the company and the job responsibilities in order to attract qualified candidates.
The job description includes unrealistic and extravagant goals that are not grounded in reality. This is likely due to the exaggerated and self-aggrandizing language used in the previous section. It does not reflect the actual demands and responsibilities of the job and may discourage qualified candidates from applying.
The job requirements listed are unrealistic and impractical. Demanding that an applicant be able to drive a car, fighter-jet, and unicycle simultaneously is unrealistic and unnecessary for the job.
Here’s an example for DevOps specialist position, taken from a LinkedIn. This is a current posting, but they didn’t change for decades — all the same.
Description
Come [legally] hack with us the data on the largest exchange that’s running our world. Not NASDAQ; the one with way more events - the Global Ads Exchanges, where millions of ads are born and clicked every second.Step behind the curtain of algorithms and competitors that move $1T of annual budgets. Plunge into a world of ISP-volumes of traffic, sub-second predictions and TBs of live, real-world data. Use cutting-edge analysis, ML and engineering, or just plain hacker-like thinking to out-perform the market.
…another 5 paragraphs of showing-off that could be replaced just with “XX% of internet ads are ours — come join us”..
If you are experienced but still hungry to learn and impact - we’d love to have you on our team!
You’ll be responsible for:
Scaling our RTB bidders and ML prediction infrastructure to support extreme loads of data and traffic - 1m QPS.
Own deployment, monitoring, troubleshooting, maintenance, and uptime of our production cloud environments.
Infrastructure for massive data (1TB/hr) ingestion, continuous ML training and real-time prediction.
Building, updating, and implementing CI/CD pipeline and DevOps automation processes, methodologies, and tools.
Work closely with Engineering and Data teams, taking full responsibility and ownership from conception to post-deployment in a collaborative, fast-paced environment
Stay on top of modern technologies with our infra stack: Prometheus, Graphana, Python3, Go, BigQuery, Redis, MySQL, Nginx/Kong, Bash, Jira
Requirements
3+ years of experience as a DevOps Engineer role preferably at a startup company
Strong technical skills, good system and infrastructure understanding
Experienced with building the full application release cycle (CI/CD)
Familiar with how modern web applications work and scale
Networking, firewall rules management and application security knowledge
Ability to see the bigger picture and carry out system architecture planning
Proven DevOps and Infrastructure experience - Advantage
Understanding of product and a passion for building software that impacts millions of users
Experience with Redis, relational and NoSQL databases\data warehouses or equivalent
A “Self-starter” with a startup mentality, Independence with a sense of urgency.
This text does not provide almost any useful information for a potential candidate. It is simply a wall of words that does not convey any meaningful information about the company and keywords not describing the job. The job description does not provide any information about the specific tasks that the candidate will be responsible for. Additionally, some of the listed keywords may require a separate specialist with specialized skills and expertise, if it’s gonna be a significant part of the job outside the “deploy and forget” approach.
Most job postings focus on superficial details that are not relevant to the role of a DevOps engineer. These details, such as the size of the company or its listing on NASDAQ, are included to make the company appear more attractive to candidates. However, a DevOps engineer is typically more concerned with the technical aspects of the job and may not care about the size of the company or its mission.
Over the years, I have not come up with a better alternative to these overly verbose and ineffective job descriptions. I’ve just thrown them away; my own descriptions were straightforward and simple, stating only that the company is called “Companyname” and that it sells a lot of tours. Then there was a quite detailed description of the technology stack used. Despite their simplicity, these descriptions were sufficient for anyone who applied to these jobs. If someone was willing to know more about the company itself — company web-site welcomes everyone. Most probably, the truth here is somewhere in-between.
So, after the tedious process of trying to get any means out of job descriptions, a candidate applies to something that looks less awful than others. And steps into the another boiling pot — interviews.
The absolute most of companies follows the extremely old-fashioned, traditional chain in their hiring process, whoever they’re looking for:
First touch with an “HR specialist” — 15 to 30 minutes
Second call with a “Hiring manager” — 40-90 minutes
Third call with someone else acting as another “Hiring manager” to get another opinion — 40-90 minutes
Completion of some test assignment (online or offline) — 2-12 hours
Fourth call to discuss the results of the assignment, terms of works etc. — 30-60 minutes
Signing up/Rejection with apologies
Overall, based on the lowest estimate of time required, this process takes 245 minutes of the candidate’s time and the same amount of time from the hiring company’s employees. This also adds time spent reviewing candidate’s resume, previous meeting notes, etc. Additionally, two of the employees involved in the process typically have a higher pay grade than the candidate, so this process costs even more in terms of money for the company.
Furthermore, candidates often have several of these processes happening at the same time, which can be quite stressful in and of themselves. Additionally, the pressure of having to solve multiple test cases while also trying to do their current job can lead to the candidate becoming completely burned out and eager for a six-month sabbatical by the time they join the new company.
The Fireworks
Here we come to the solution I found to simplify the hiring process for everyone, literally the best decision of my life as a hiring manager — the hiring process shall be done backwards, starting from the test assignment!
So, my current process since then is the following:
A pack of tasks published in a public GitHub repo, containing the actual tasks that were completed earlier during the job.
Some tasks are simplified, while others are unnecessarily complicated. The complicated tasks are used to determine if the candidate is overqualified for the job and will likely quit soon due to boredom. This process also helps filter out people who have attempted to scam me by taking advantage of the common hiring process.
The trick is that the candidate can see what they will be dealing with at the new job and estimate their interest in it. They are not forced to return the solution as soon as possible, avoiding being labeled a “slow-thinker”. I allow the candidate to enjoy the test assignment, rather than racing through it. They know that someone else may be doing it as well, but this is a less stressful situation than getting an assignment on a Monday morning and knowing that they only have free time on the weekends, which could potentially result in a failed assignment.
Candidates have to solve some problems of their choice out of the list, according to their experience, attach their CV and send a pull-request to the repo.
People see this as a fair challenge because everyone receives the same task list and they do not suspect that I am using their “free labor” to solve my job problems..
I review every but a very small number of PRs and choose the ones I like the most to review the resumes of the candidates. At this stage, there are usually only two or three people left. The rest receive a rejection of their PR with my comments on why they were not selected.
I’m setting an interview with these chosen people, usually leaving only one as a result.
The finalist goes to HR to complete all the necessary HR paperwork..
Signing the contract.
In the past eight years, I have used this process to hire about a hundred people, both for myself and for small companies where I am a friend of the business owner. None of the people I have hired this way have ever disappointed me or the people I hired them for, which I take as a sign that I am doing things right.
Outlines
Q: How did I solve the issue of hiring a good programmer when I am not a programmer myself?
A: I simply found a proven programmer and asked him to write test cases for me and review PRs later. This cost me just a few beers at a bar later.
Q: How do I filter out people who have solved test cases using Stack Overflow or otherwise cheated?
A: There isn’t an immediate way to find this out. At the same time it’s not necessarily important how a task is completed, as long as it is completed. For lower level positions, it’s common for people to use Stack Overflow to solve problems. However, tasks for rock-star positions are usually not solvable using these types of resources. So, for the most cases, it’s helpful to have a voice interview where you can discuss a different, non-similar problem and see how the candidate thinks through and solves it. That would give you a clear view of whether the candidate cheated or spent a week on a 30-minute problem but solved tasks on their own.
Q: What are your voice interviews about if you’ve already seen the code?
A: Exactly, I’ve already seen the code and have a general impression of what this candidate is capable of. In general, I’m just having a casual conversation, similar to what you might have at an office kitchen. I’m telling stories, hearing stories, and trying to determine if this person is someone I would enjoy having a beer with on Thursday night after work or not.
Q: Can you provide an example of a proficient GitHub repository that helped you find a valuable candidate?
A: Sure thing. Here you are: https://github.com/agritask/publictest I posted that link to the DevOps chat on Telegram, which has about 4000 people in it. I received several messages and PRs, and ended up hiring one of the best colleagues I’ve ever had.
IV: Deploy kafka (RedPanda actually) to our k3d cluster
Deploying “Kafka”
Actually, we’re going to deploy RedPanda which is a “kafka-compatible” messaging solution. Lighter, faster, cheaper than Apache/Confluent Kafka.
III: Building kubernetes home lab with k3d — Service mesh and Postgres
Part III: Deploying service mesh and Postgres to our homelab kubernetes cluster
Traefik Mesh
We’re not going to deploy something like shiny enterprizeish Istio. Instead we will deploy the simplest service mesh of all time — Traefik Mesh
If you don’t know what service mesh is and not required with the task to have a service mesh capabilities, then most likely you don’t need it and may skip this part.
NAME: traefik-mesh
LAST DEPLOYED: Mon May 30 00:58:56 2022
NAMESPACE: traefik-mesh
STATUS: deployed
REVISION: 1
TEST SUITE: None
NOTES:
Thank you for installing traefik-mesh.

Your release is named traefik-mesh.

To learn more about the release, try:

  $ helm status traefik-mesh
  $ helm get traefik-mesh
I recommend using Lens to launch terminal sessions in pods just for simplicity.
To make your service supported by the mesh you need to make some changes to your deployment yaml. Details are in Traefik Mesh documentation
Postgres
We’ll install a kubernetes-native Stackgres version of the Postgres, that runs as a cluster with a lot of bells a whistles helping to diagnose, debug and service databases.
apiVersion: v1kind: Servicemetadata:
namespace: stackgresname: stackgres-restapiannotations:
meta.helm.sh/release-name: stackgres-operatormeta.helm.sh/release-namespace: stackgreslabels:
app.kubernetes.io/managed-by: Helmspec:
#type: 'LoadBalancer'type: 'ClusterIP'#<<=== here is your edit. Original line is above.selector:
app: stackgres-restapiports:
- name: httpsprotocol: TCPport: 443targetPort: https
Now apply it:
kubectl apply -f stackgres-operator-demo.yml
Output:
namespace/stackgres created
customresourcedefinition.apiextensions.k8s.io/sgbackups.stackgres.io created
customresourcedefinition.apiextensions.k8s.io/sgbackupconfigs.stackgres.io created
customresourcedefinition.apiextensions.k8s.io/sgclusters.stackgres.io created
customresourcedefinition.apiextensions.k8s.io/sgdbops.stackgres.io created
customresourcedefinition.apiextensions.k8s.io/sgdistributedlogs.stackgres.io created
customresourcedefinition.apiextensions.k8s.io/sginstanceprofiles.stackgres.io created
customresourcedefinition.apiextensions.k8s.io/sgobjectstorages.stackgres.io created
customresourcedefinition.apiextensions.k8s.io/sgpoolconfigs.stackgres.io created
customresourcedefinition.apiextensions.k8s.io/sgpgconfigs.stackgres.io created
clusterrolebinding.rbac.authorization.k8s.io/stackgres-restapi-admin created
clusterrolebinding.rbac.authorization.k8s.io/stackgres-restapi created
service/stackgres-operator created
service/stackgres-restapi created
deployment.apps/stackgres-operator created
deployment.apps/stackgres-restapi created
serviceaccount/stackgres-operator-crd-upgrade created
serviceaccount/stackgres-operator-init created
serviceaccount/stackgres-operator created
clusterrole.rbac.authorization.k8s.io/stackgres-operator-crd-upgrade created
clusterrolebinding.rbac.authorization.k8s.io/stackgres-operator-crd-upgrade created
clusterrolebinding.rbac.authorization.k8s.io/stackgres-operator-init created
job.batch/stackgres-operator-crd-upgrade created
serviceaccount/stackgres-restapi created
job.batch/stackgres-operator-create-certificate created
job.batch/stackgres-operator-bootstrap created
job.batch/stackgres-operator-wait created
secret/stackgres-restapi created
configmap/stackgres-operator-grafana-dashboard created
configmap/stackgres-restapi-nginx created
clusterrole.rbac.authorization.k8s.io/stackgres-operator created
clusterrole.rbac.authorization.k8s.io/stackgres-restapi created
clusterrolebinding.rbac.authorization.k8s.io/stackgres-operator created
Ingressroute for Stackgres operator
Now create a new ingressroute for this new service: ingressroute.stackgres.yml
and apply it with kubectl create -f stackgresCluster.yml
This will take a LONG time. Watch your Lens-Workload-Pods page to control the state.
At least you have the time to have a coffee.
Now check it works:
kubectl exec -ti "$(kubectl get pod --selector app=StackGresCluster,role=master -o name)" -c postgres-util -- psql
Should open psql shell.
we’re using bitnami because we want only nginx server without ingress controller and other stuff which is deployed by default from the official Nginx repo
Note: documentation on Bitnami Nginx chart is available here
Output:
Hang tight while we grab the latest from your chart repositories...
...Successfully got an update from the "bitnami" chart repository
Update Complete. ⎈Happy Helming!⎈
Metrics.enabled is set to true to be used later here. Service.type was set because by default its setting is LoadBalancer but we already have Traefik here so it will make the deployment generating a lot of errors and overall inoperable.
If you’ll decide later to change any parameters, the easiest way is to uninstall the chart and deploy again: helm uninstall test-nginx. The right way is the “Rolling update”, but we’re not discussing it here yet
Create Ingress route for our Nginx
Copy the ingressroute.yml to a new file, e.g. ingressroute.nginx.yml and make it look like this:
Now save and apply with k apply -f ingressroute.nginx.yml
Note that we didn’t specify namespace neither in helm deployment nor ingress route deployment. So our Nginx is running at the default namespace.
For the purposes of this tutorial it’s ok, but you should consider specifying namespaces for everything you’re doing in Kubernetes, because having everything in the default one will make your life tough and painful.
Point your browser now to http://k3d.local/ and you should see the “Welcome to nginx!” page.
Setting up Prometheus and Grafana
Deploying Prometheus and Grafana to our test cluster
This may take a while since your k3d cluster is pulling all the required images and they’re quite big
Output:
NAME: monitoring
LAST DEPLOYED: Sun May 29 18:31:56 2022
NAMESPACE: default
STATUS: deployed
REVISION: 1
NOTES:
kube-prometheus-stack has been installed. Check its status by running:
  kubectl --namespace default get pods -l "release=monitoring"

Visit https://github.com/prometheus-operator/kube-prometheus for instructions on how to create & configure Alertmanager and Prometheus instances using the Operator.
kubectl --namespace default get pods -l "release=monitoring"
NAME                                                   READY   STATUS    RESTARTS   AGE
monitoring-kube-state-metrics-56bfd4f44f-nmpr8         1/1     Running   0          2m44s
monitoring-prometheus-node-exporter-vf66j              1/1     Running   0          2m44s
monitoring-prometheus-node-exporter-h8qpr              1/1     Running   0          2m44s
monitoring-prometheus-node-exporter-jzxz2              1/1     Running   0          2m44s
monitoring-kube-prometheus-operator-5dbdd57558-ztd75   1/1     Running   0          2m44s
By the way, if you have already installed Lens you should see now all the fancy metrics about your cluster in a sexy infographic form at the cluster dashboard.
Exposing Grafana to the browser
First, edit the localhost line in the /etc/hosts to be like:
127.0.0.1 localhost k3d.local grafana.k3d.local
Second, as we did before, copy ingressroute.yml to a new file (e.g. to ingressroute.grafana.yml) and make it look like that:
I: Building kubernetes home lab with k3d — Cluster deployment
Part I: Kubernetes homelab with k3d
Let’s assume that you’re a developer or junior DevOps engineer who got the task “This thing must run in Kubernetes tomorrow” but you have no clue what the hell Kubernetes is and have to learn it ASAP to have your job the day after tomorrow.
Disclaimer: Kubernetes is a multilayered abstraction realm for running various stuff isolated in sandboxes and make all this stuff communicate and collaborate at the same time. User/admin has some control over the Kubernetes to ask it do things in a desired way. The deeper you’re getting into it, the more scary it becomes, but it’s ok - everyone feels himself completely pissed off by Kubernetes at least 9100 times while learning it.
Getting your first Kubernetes cluster running
Prerequisites
Linux/MacOS
Docker
This guide may be used on Windows, but it will require some changes to the operations/command that will NOT be highlighted here.
Deploying the lightweight dockerized k8s cluster using k3d
There are several methods how to install k3d on your computer and by default it’s offered to use crazy popular method like wget https://something/install.sh | bash. But it’s insanely stupid to use that method for many quite obvious reasons. If you’re not aiming to become a somewhat good DevOps, then just remember that this method fucks up all your security unless you are the author of the script.
Go to the Releases page and download the appropriate release for your OS/arch. Then chmod +x on the binary and put it somewhere in your $PATH. Or put somewhere and add this path to $PATH.
Whatsoever installation method you choose, lets start.
Note: With the parameters -p "80:80@loadbalancer" and -p "443:443@loadbalancer" we’re tellind k3d to occupy local ports 80 and 443 and route traffic to the cluster loadbalancer. These parameters are vitally important because otherwise you’d be unable to reach your applications in the cluster over the network.
If you’re planning to have any services on other ports — just add the corresponding ports to this command.
Output
INFO[0000] portmapping '80:80' targets the loadbalancer: defaulting to [servers:*:proxy agents:*:proxy]
INFO[0000] portmapping '443:443' targets the loadbalancer: defaulting to [servers:*:proxy agents:*:proxy]
INFO[0000] Prep: Network
INFO[0000] Created network 'k3d-kube'
INFO[0000] Created image volume k3d-kube-images
INFO[0000] Starting new tools node...
INFO[0000] Starting Node 'k3d-kube-tools'
INFO[0001] Creating node 'k3d-kube-server-0'
INFO[0001] Creating node 'k3d-kube-agent-0'
INFO[0001] Creating node 'k3d-kube-agent-1'
INFO[0001] Creating LoadBalancer 'k3d-kube-serverlb'
INFO[0001] Using the k3d-tools node to gather environment information
INFO[0001] Starting new tools node...
INFO[0001] Starting Node 'k3d-kube-tools'
INFO[0002] Starting cluster 'kube'
INFO[0002] Starting servers...
INFO[0002] Starting Node 'k3d-kube-server-0'
INFO[0005] Starting agents...
INFO[0006] Starting Node 'k3d-kube-agent-1'
INFO[0006] Starting Node 'k3d-kube-agent-0'
INFO[0017] Starting helpers...
INFO[0018] Starting Node 'k3d-kube-serverlb'
INFO[0024] Injecting records for hostAliases (incl. host.k3d.internal) and for 5 network members into CoreDNS configmap...
INFO[0026] Cluster 'kube' created successfully!
INFO[0026] You can now use it like this:
kubectl cluster-info
$kubectl get nodes
NAME                STATUS   ROLES                  AGE   VERSION
k3d-kube-server-0   Ready    control-plane,master   44s   v1.22.7+k3s1
k3d-kube-agent-0    Ready    <none>                 35s   v1.22.7+k3s1
k3d-kube-agent-1    Ready    <none>                 35s   v1.22.7+k3s1
Here we see that we got control plane and master node. But we need a space to deploy stuff. Lets go for worker nodes; apparently we’ll create two of them.
Check it
$k3d node list
NAME                ROLE           CLUSTER   STATUS
k3d-kube-agent-0    agent          kube      running
k3d-kube-agent-1    agent          kube      running
k3d-kube-server-0   server         kube      running
k3d-kube-serverlb   loadbalancer   kube      running
k3d-kube-tools                     kube      running
Check docker containers status
$docker ps -a
CONTAINER ID   IMAGE                            COMMAND                  CREATED         STATUS         PORTS                                                               NAMES
e2cdc91188d7   ghcr.io/k3d-io/k3d-tools:5.4.1   "/app/k3d-tools noop"    3 minutes ago   Up 3 minutes                                                                       k3d-kube-tools
f3c3cf1da08a   ghcr.io/k3d-io/k3d-proxy:5.4.1   "/bin/sh -c nginx-pr…"   3 minutes ago   Up 2 minutes   0.0.0.0:80->80/tcp, 0.0.0.0:443->443/tcp, 0.0.0.0:51772->6443/tcp   k3d-kube-serverlb
1bca176b8b44   rancher/k3s:v1.22.7-k3s1         "/bin/k3d-entrypoint…"   3 minutes ago   Up 3 minutes                                                                       k3d-kube-agent-1
a57669c52085   rancher/k3s:v1.22.7-k3s1         "/bin/k3d-entrypoint…"   3 minutes ago   Up 3 minutes                                                                       k3d-kube-agent-0
94d7133d3d5c   rancher/k3s:v1.22.7-k3s1         "/bin/k3d-entrypoint…"   3 minutes ago   Up 3 minutes                                                                       k3d-kube-server-0
Everything seems fine.
Tricking DNS
Now we need to make some trick with DNS to avoid future issues with addressing to localhost — edit the /etc/hosts file.
Run sudo vim /etc/hosts and at the end of line with 127.0.0.1 localhost add k3d.local
It should become 127.0.0.1 localhost k3d.local
Deploying our first service
Disclaimer: I got sick at some moment typing all these kubectl get ... so I made some aliases listed below and added them to my ~/.zshrc.
alias k=kubectl
alias kg="kubectl get"
alias kgp="kubectl get pods -o wide"
alias kgpa="kubectl get pods --all-namespaces"
alias kgs="kubectl get services -o wide"
alias kgsa="kubectl get services --all-namespaces -o wide"
alias kgi="kubectl get ingresses"
alias kgia="kubectl get ingresses --all-namespaces"
alias kd="kubectl describe"
alias kdp="kubectl describe pod"
alias kds="kubectl describe service"
alias kdd="kubectl describe deployment"
alias kdi="kubectl describe ingress"
The most popular test service is «Whoami» by Traefik labs. At the GitHub there is a very nice deployment example for that service for Kubernetes.
git clone https://github.com/pacroy/whoami && cd whoami
Now change whoami.yml in line 6 to have replicas: 2
And since we’re having two replicas of the whoami pod, we can refresh the page and we’ll see how responding IP address and Port are changing which means whe’re successfully reaching both of our pods with the service. Hooraaah!
Now you have a fully functional Kubernetes cluster on your local machine.
Some useful notes
Install OpenLens — this is an awesome tool to manage your clusters and environments. Can’t get overexcited about it.
This cluster has Traefik ingress controller deployed by default. Traefik is a lightweight yet powerful router/proxy for Kubernetes, though it has a quite steep learning path. https://docs.traefik.io/ is your best friend with that.
Please be advised that I may not be able to receive or process any physical mail or hard-copy documents sent to me. For this reason, it is strongly recommended that any correspondence or documents intended for my attention be sent in digital form to my email address — papers(at)y-b.one.
If you choose to send materials on paper, please ensure that a digital copy is also sent via email. I cannot guarantee the timely receipt or review of physical documents, and no claims or complaints will be accepted regarding unacknowledged or undelivered hard-copy materials. Thank you for your understanding and cooperation.
Effective since March 23, 2025.
Seamlessy dump, encrypt and compress your database to the cloud
There are a lot of places where using cloud databases isn’t a production solution for various reasons. We’re not going to discuss that, but will backup the Postgres database to the cloud and encrypt it on the fly. There is no difference what type of DB to dump — we will use Postgres just as an example.
There are several common options on how to backup database:
make a complete database dump to file
backup database’s transaction log between full dumps
For really large databases the second option could be the only way to not get broke by the storage bills, but for databases less than 30GB in size a daily full dump is the best solution.
Enough smalltalk, let’s go with a Bash script that will be executed by cron daemon at the desired least busy time.
I, personally, like the colored output. That allows me to quickly overwatch the log for the red signs to see exactly where something has gone wrong. I use coloring even for the small scripts just in sake of sameness.
#!/bin/bash
# set -xRED='\033[0;31m'GREEN='\033[0;32m'BLUE='\033[0;34m'NC='\033[0m'
Then we’re going to declare some variables.
Note that we’re declaring a variable containing a list of databases which names are beginning with a “prod” string by executing a simple cli-query against the database server. Google out the same command for your own DB engine to have this feature in your script.
TIME=`date +%H:%M:%S`S3COMMONPATH="s3://pg-backup.prod.domain.xyz/"S3MONTHLYPATH="s3://pg-backup.monthly.prod.domain.xyz"FILENAME=""MONTHLY="False"DATABASES=$(sudo -u postgres psql -qAtX -c "SELECT datname FROM pg_database WHERE datname LIKE 'prod%';")
Here the action starts.
First of all we echoing the time script started working and a banner to make it easy to separate different stages if you’ll get this script extended.
Then we estimating isn’t it a time to make a monthly copy to a separate bucket and storing the result in the variable.
echo -e "${GREEN}\n\n[ INFO ] Script started at `date +%Y%m%d-%H:%M`\n"echo -e "${GREEN}========================================================
|| ||
|| DUMPING DATABASES ||
|| ||
========================================================
${NC}"if[`date +%d` -eq 01]; then MONTHLY="True"fi
Then the function trick comes in making available a separate background process for each DB at the server, but be careful — multiple parallel dumps may make server falling on its knees while processing.
This function is being launched as a background process for every database found at the server.
The main trick is extensive use of pipes avoiding the storing and processing backups locally which may lead to errors and server crashes due to lack of space.
First of all, we launching everything in a try-catch cycle. Because we want to know things gone wrong.
Let’s go over first if cycle:
we’re calling the pg_dump for the DBname given and piping it to the
gpg application that will encrypt everything piped by pg_dump and compress it on the go. I’ve found that zipping using pg_dump costs a lot more CPU than using gpg. Then gpg piping output directly to the
aws-cli which is storing the input at the desired S3 bucket using the $FILENAME variable set.
At the second part of the function, we’re checking the state of $MONTHLY variable and if true — copying the resulting file from one bucket to another using aws-cli.
This is the final part of the script which is a kind of “main” function. Here we’re iterating over the $DATABASES variable and launching background processes for each. Note that process called is being sent to the background if & is placed at the end of the command, and wait after the iterator will tell the script that it should wait until all background processes are finished before finishing its job.
And at the end, we’re echoing the finish time of the script.
while read -r dbname; do backup &
done<<<"$DATABASES"wait
echo -e "${GREEN}\n\n[ INFO ] Script done at `date +%Y%m%d-%H:%M`\n"
The final batch:
#!/bin/bash
# set -xRED='\033[0;31m'GREEN='\033[0;32m'BLUE='\033[0;34m'NC='\033[0m'TIME=`date +%H:%M:%S`S3COMMONPATH="s3://pg-backup.prod.domain.xyz/"S3MONTHLYPATH="s3://pg-backup.monthly.prod.domain.xyz"FILENAME=""MONTHLY="False"DATABASES=$(sudo -u postgres psql -qAtX -c "SELECT datname FROM pg_database WHERE datname LIKE 'prod%';")echo -e "${GREEN}\n\n[ INFO ] Script started at `date +%Y%m%d-%H:%M`\n"echo -e "${GREEN}========================================================
|| ||
|| DUMPING DATABASES ||
|| ||
========================================================
${NC}"if[`date +%d` -eq 01]; then MONTHLY="True"fifunction backup { echo -e "${GREEN}[ INFO ] `date +%H:%M:%S` Backing up: $dbname.${NC}" FILENAME="$dbname/$dbname"_`date +%Y%m%d-%H%M`.pg_dump.gpg
if sudo -u postgres pg_dump -b -p 5432 -Fc "$dbname" |
/usr/bin/gpg --batch --yes --no-use-agent -c --cipher-algo AES256 --passphrase-file "/home/backupuser/.conf/gpg_passphrase" -z 5 |
/usr/local/bin/aws s3 cp - ${S3COMMONPATH}${FILENAME}then echo -e "${GREEN}[ INFO ] `date +%H:%M:%S` $dbname dumped successfully${NC}"else echo -e "${RED}[ FAIL ] `date +%H:%M:%S` $dbname pgdump failed!${NC}"fiif[${MONTHLY}= True ]; thenif /usr/local/bin/aws s3 cp ${S3COMMONPATH}${FILENAME}${S3MONTHLYPATH}$dbname/; then echo -e "${GREEN}[ INFO ] `date +%H:%M:%S` $dbname copied successfully to monthly storage${NC}"else echo -e "${RED}[ FAIL ] `date +%H:%M:%S` $dbname copy to monthly storage failed!${NC}"fifi}while read -r dbname; do backup &
done<<<"$DATABASES"wait
echo -e "${GREEN}\n\n[ INFO ] Script done at `date +%Y%m%d-%H:%M`\n"
Now place the script somewhere and give it “executable” permission using chmod 755 /path/to/your/script.sh
Now, edit the crontab using sudo -u %USERNAME% crontab -e where %USERNAME% is your backup user which has aws-cli configured with the special permissions keys allowing it only to put backups to the buckets because we’d like to avoid a complete disaster if these creds got compromised, right?
Also we’re lowering the process priority executing nice just in case someone is using the server and we don’t want to freeze database response by our backup process.
And the last thing: don’t forget to install gpg and check the path to it and change if necessary in the script.
Extending Kubernetes
This keynote is in Russian, sry.
Расширяем и дополняем Kubernetes / Андрей Половов, Иван Михейкин (Флант)
Re:Start
After a long-long time passed, finally, this site is going for resurrection. :)
Since the last post I’ve moved from Russia to Israel, learning almost new profession and made my life a lot easier overall.
So, I decided to use that space to copy-paste usefull topics that respond my current interests. So here would appear various things related to DevOps methology and instruments, cycling, motorcycling, aviation and and other things I’d fell in love with.
So, once upon a time you heard that password reusage is a bad idea. But you have dozens servers under control and have to take care of them all. Of course you can use password managers like LastPass, 1Password etc and this is fine. Sure thing that you’re using SSH-keys to authorize yourself against these servers. But there is a one small thing that ruins all this beauty — compromising your key and/or losing access to password manager makes your servers vulnerable and inaccessible.
Here one-time passwords come in.
There are a lot of OTP providers around: Google Authenticator, Auth0 etc. But all of them require additional device to be accessible by you. And this device becomes a point of failure: if it’s compromised or inaccessible you’re getting into troubles again. So here comes a question:
How I can deploy a secure OTP without dependencies and 3rd-party devices?
You have to use a web-system that is obscured but accessible and provides you with the password data.
The goal is to make a web-service that will generate one-time passwords for the user known only by you so you can access it using ssh and received one-time password.
I’m a pretty lazy and don’t like dependencies. So I wrote this service using Bash and this script utilizes only the well-known components that are included in most Linux distro’s by default.
This is a single file that generates a random password with using RANDOM function twice and hashing it with MD5. Then the result is set as a password to desired user for 10 seconds. In 10 seconds after the password exposure its being reset again.
This is a script for having one-time passwords to connect to the servers from the places you’re not sure are safe. Or in case you are away from the computer with the ssh-keys that server knows.
By default script uses user “looper” — change it to your desired username.
By default it uses simple function to generate a somewhat random number, combine it with the current system time and hash it twice then to get as most random sequence as possible without any dependencies.
You’re free to code any function you prefer to get any random character sequence.
The resulting hash is the password.
Your secret is the username used to login.
Script gives you 10 seconds to enter the revealed password, then resets it again.
So you just running this script and it listens to web-requests on a certain port. In 10 seconds after password was exposed it resets again in a loop.
Second variant to generate one-time password and don’t expose it in plain text:
Note the ‘123’ multiplier — this is a “second secret” which you have to use to get real password.
So you have to divide the exposed number by 123 to know the one-time password (keep in mind 10 seconds countdown to next reset)
You can enchance security even more, by placing the script to another server thus it will change the password over ssh-connection.
Change the line 28 to:
ssh user@yourserver.somewhere "echo \"looper:$PW\" | chpasswd"
Just don’t forget to add key from originating server to the host and use correct user.
How to use:
Place this script to any accessible path, e.g. /usr/share/bin
chmod +x on it
Add script with the full path to the /etc/rc.local to launch it at every boot.